Environmental Impacts
Water Footprint in Poultry Meat Production
Human beings both affect the environment and are affected by the environment throughout their lives. Since the 1980s, with industrialization, urbanization, technological advances and rapid population growth, production and consumption processes that disrupt the balance of nature have emerged. Over time, this has caused global environmental problems that threaten all living things. With the increasing environmental problems affecting the world, studies on what can be done to meet today's needs without using the resources of future generations have gained importance. With the increasing world population and needs, globalization has increased the pressure on natural resources day by day. Environmental footprints have been calculated and tracked globally in order to reduce these pressures. Environmental impacts of individuals and sectors in many ways are revealed by methods such as carbon footprint, ecological footprint and water footprint. In this article, we will evaluate the water footprint specifically for animal production.
Water footprint is the measure of the total amount of water consumed directly and indirectly in the production and consumption processes of the products and services we use. It also covers the amount of water consumed from the first step of the supply chain to the final consumer and the water pollution caused.
Water footprint is measured by the production of one tonne of a product, planting one hectare of agricultural land, volume of water consumed in meter cube (m3) for 1 TL of a service.
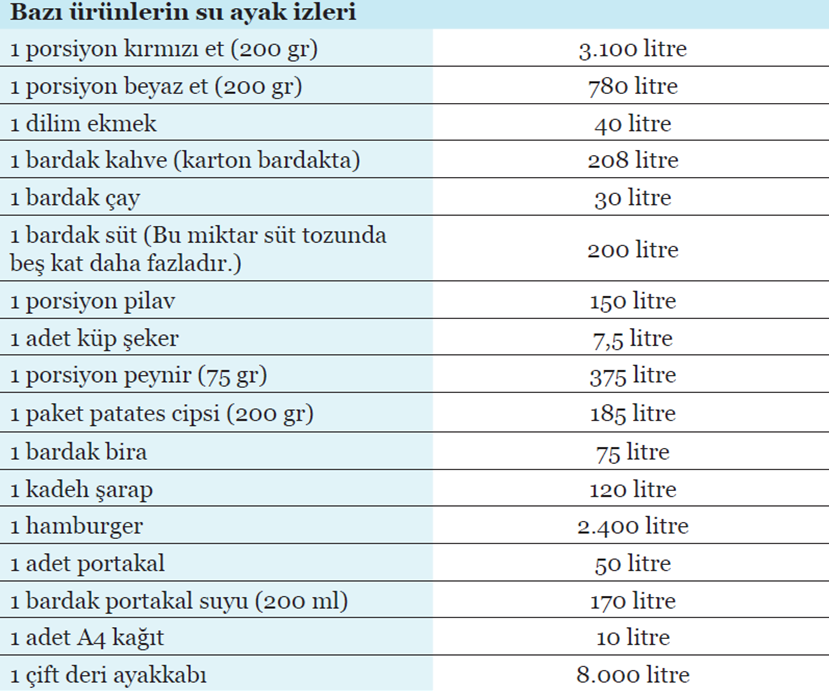
Water is used directly for activities such as cooking, washing and cleaning in daily life. There is also indirect water consumed in the process from the clothes we wear to the production of the coffee we drink. For example, the water footprint of a cup of coffee is 208 litres and the water footprint of a 300-gram t-shirt is 2,500 litres. The average daily water footprint of a person is about 150 lt. More than half of this amount is due to the foods we consume. Therefore, the water footprint is of great importance for a sustainable life.
Water is a key input to every economy, such as energy. The presence and quality of water varies from country to country and it is also a global and collective issue today, when the world population is constantly increasing and natural resources are no longer sufficient, as is the local issue of each country or region.
There are three types of water footprints:
- Blue water footprint refers to the total amount of underground and surface water resources used directly or indirectly in the production process of a good or service. In particular, the use of irrigated agriculture, industrial and domestic water each refers to the blue water footprint.
- Green water footprint is the total amount of rainwater used directly or indirectly in the production process of a good or service. It covers rainwater used especially in agriculture, horticulture and forestry activities and the water in the product.
- Gray water footprint is the amount of fresh water required to dilute the concentration of pollutants in wastewater directly discharged or indirectly mixed to natural water sources such as lakes, streams and seas in order to meet certain water quality standards.
It is possible to calculate the water footprint on an individual, process, product, sector, city, country or global scale. As a result of comparing the water footprint with the amount of fresh water required for the goods and services produced in the country, it is determined whether the country is a virtual water importer or exporter.
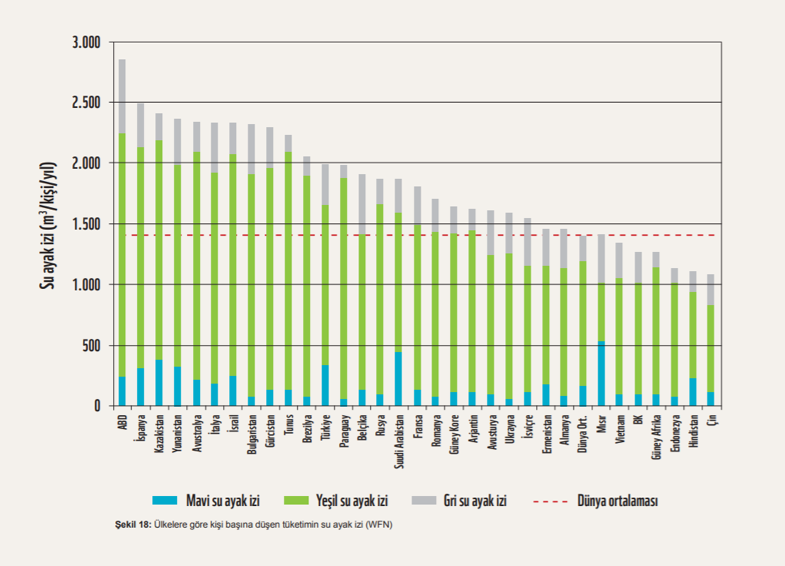
The water footprint of production is the amount of local water resources used to produce goods and services within the country. This water footprint may be partly inside and partly outside the country depending on the local production or import of the products. Countries with limited water resources, such as North Africa, Mexico and the Middle East, for example, and such as Japan and Singapore with limited land areas, are dependent on imported goods to meet a large part of their population's needs. For this reason, there are big differences in the water footprint of countries' consumption. The average annual water footprint per capita in the USA is 2842 m3, 1.071 m3 in China and 1624 m3 in Turkey. It is 20% above the world average of 1385m3. Europe, which is rich in water resources and soil area, keeps 40% of the water footprint out of its borders.
The total external water footprints of the nations in the world constitute 16% of the total global water footprint. However, the share of external water footprint varies greatly from country to country. In some African countries, such as Sudan, Mali, Niger, Ethiopia, Malawi and Chad, there are almost no external water footprints, because there are very few imports. Some European countries, on the other hand, e.g. Italy, Germany, the United Kingdom and the Netherlands have external water footprints that contribute 50-80% of the total water footprint. The most contributing agricultural products to the external water footprints of the nations are as follows: beef, soybeans, wheat, cocoa, rice, cotton and corn.
Differences in the internal and external water footprint of consumption are also large. In the Netherlands, 95% of the water footprint of consumption is found elsewhere in the world through imported goods, while in India and Paraguay, only 3% of the national water footprint of consumption is outside the country. India (13%), China (12%) and the United States (9%) are the largest consumers of global water resources.
http://awsassets.wwftr.panda.org/downloads/su_ayak_izi_raporweb.pdf
Water footprint calculations of Turkey reveal that 80% of production and consumption in the country are based on inland water resources. This indicates that the sustainability of fresh water sources directly affects the country's economy. Water footprint of consumption in Turkey and water footprint of production are almost equal. Similarly, virtual water entering the country with imports is equivalent to the amount of virtual water leaving the country with exports.
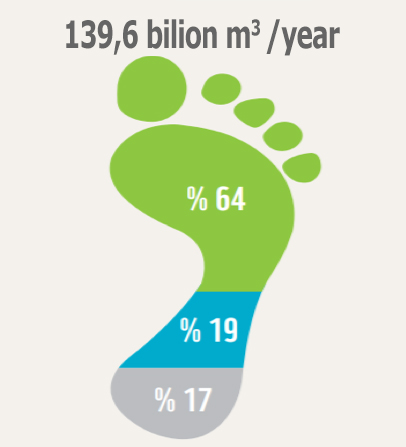
Water footprint of production in Turkey is approximately 139.6 billion m3/year. 64% of the water footprint resulting from production in Turkey is green water footprint; blue water footprint is 19% and gray water footprint is 17%.
http://awsassets.wwftr.panda.org/downloads/su_ayak_izi_raporweb.pdf
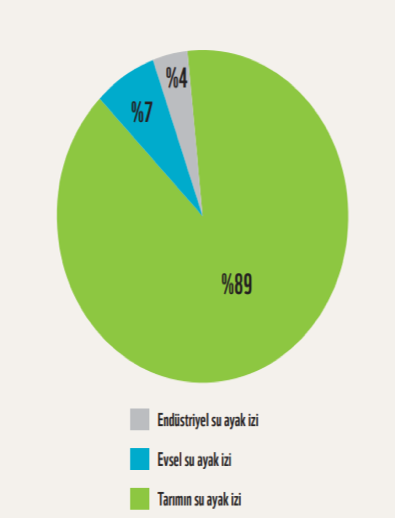
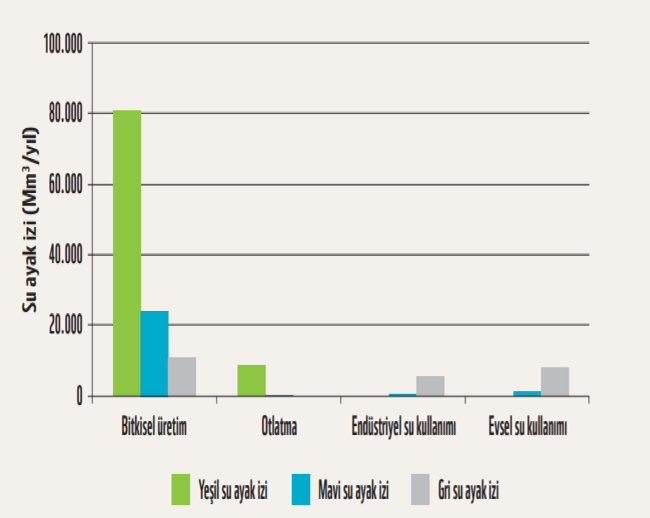
Agriculture accounts for 89% of the water footprint. Domestic water use and industrial production cover 7% and 4% of all water footprints, respectively. 92% of the water footprint of agriculture stems from vegetable production and 8% from grazing. When we look at the water footprint of plant production, it is seen that the largest share belongs to grains with 38%. Grains are followed by forage crops with 31%. Industrial fruits make up 13%, oil plants 5%, vegetables and legumes 2%.
http://awsassets.wwftr.panda.org/downloads/su_ayak_izi_raporweb.pdf
To produce one kilogram of beef, about 15,000 litres, or 15 cubic meters of water (equivalent to leaving a tap running for about 20 hours) is needed. Of these, 93% are green, 4% are blue, 3% are gray water footprints.
http://awsassets.wwftr.panda.org/downloads/su_ayak_izi_raporweb.pdf
Since the most important part of the animal water footprint comes from the feed they consume, the water footprint per feed unit is an important factor in determining the water footprint of the animals and related products. Poultry raised in industrial systems consume 3.2 times less feed (dry substance) per unit of production than extensive systems. While a feeding program containing 40% concentrated feed is applied in extensive production systems, 70% concentrated feed is applied in industrial systems.
The water footprint of any type of meat is mostly determined by the feeding of animals. Globally, the main component of the animal feed water footprint is related to pasture (38% of the total water footprint), followed by maize (17%), forage plants (8%), soybean meal (7%), wheat (6%), barley (6%) and oats (3%). Overall, concentrated feeds have relatively more blue and grey water footprints, while by-products, residues and coarse feeds have relatively low water footprints. Industrial systems use a lot of concentrated feed, and they usually have more blue and grey water footprints than pasture and rough feed. With the shift of food consumption habits towards more animal product consumption, it creates pressure for more production. This also increases the transition to industrial systems where more efficiency can be achieved per unit. With the increase in production and the transition to more industrial systems, more concentrated feed is used and water footprints of the livestock sector as a whole are increasing. In particular, blue and grey water footprints increase per unit product.
- 196 lt for 1 egg, 79% green, 7% blue, 13% gray
- 255 lt for 1 glass (250ml) of milk, 85% green, 8% blue, 7% gray
- 4.325 lt for 1 kg chicken meat, 82%green, 7%blue, 11%gray
- 10.412 lt for 1 kg of red meat (ovine), 94% green, 5% blue, 1% gray
- 15.415 lt for 1 kg of red meat (cattle), 94%green, 4%blue, 3%gray
https://waterfootprint.org/en/resources/interactive-tools/product-gallery/
The water footprint of poultry is mainly determined by considering the feed conversion rate (FCR) as a single factor. In the industrial system, green, blue and grey water footprint is low compared to the extensive system. Mixed and industrial poultry systems for the United States and the Netherlands have a similar water footprint. The feed conversion rate gradually improves from extensive and semi-extensive systems to industrial systems.
One of the requirements of a sustainable food is that it continues with low natural resource use and less environmental impact. In terms of resource use, 1 l of green water consumption is equal to 1 l of blue water consumption, but the impact of the green water footprint on the environment is usually much smaller than the effect of the blue water footprint. Gray water footprint is a problem as it is an indicator of pollution of groundwater and above.
In terms of sustainable consumption, especially meat species with larger blue and grey water footprints should be avoided. Differences between countries suggest that meat production is likely to reduce water footprints by establishing an appropriate balance between the feed composition with a low water footprint and the high feed conversion rate. In general, the water footprint of meat is larger than the water footprint of equivalent plant-based foods. In an industrialized country, a consumer's food water footprint has been reported to be reduced by 36% from an average meat-based diet to a vegetarian diet. The water footprint of food in general and meat in particular can be significantly reduced by changing consumption habits, but this will require a major change in the current diet pattern.
We observe three basic stimulating factors behind the water footprints of poultry, pork meat and beef. The first factor is the utilization of feed (regardless of how much feed dry matter is needed to produce meat - grazing or concentrating). There is an increase in productivity in industrial systems, from extensive systems to mixed systems, because as animals are fed more densely in industrial systems, they move less, they need less feed to grow faster and produce one unit of meat while being slaughtered at a younger age. This factor causes a general reduction in the water footprint of the meat from the extension system to the industrial systems. The second factor is the feed composition consumed by animals. More specifically, it is the ratio of concentrated feeds to coarse feeds. In general, concentrates have a water footprint larger than coarse feed. The third factor is the origin of the feed. The overall impact of the three factors depends on the relative importance of each factor depending on the situation.
For poultry, due to the utilization of high feed in industrial systems, low green, blue and grey water cause footprints compared to extensive systems. Globally, industrial systems have the largest blue and grey water footprint for beef.
In general, feed conversion rates are the largest for chickens and pigs and the smallest for cattle. This generally explains that beef has a much larger water footprint than poultry and pork.
The United Nations warns that water use has doubled its population growth rate and that, unless this trend reverses, two-thirds of the global population will face water “stress" by 2025. Human being's rate of consuming natural resources has surpassed nature's rate of self-renewal by 50%.
Global water footprint average of animal and vegetable production
|
Water Footprint lt/kg |
||||
|
|
Green |
Blue |
Grey |
Total |
|
Vegetables |
194 |
43 |
85 |
322 |
|
Fruits |
726 |
147 |
89 |
962 |
|
Cereals |
1,232 |
228 |
184 |
1,644 |
|
Legumes |
3,180 |
141 |
734 |
4,055 |
|
Hazelnut |
7,016 |
1,367 |
680 |
9,063 |
|
Milk |
863 |
86 |
72 |
1,021 |
|
Egg |
2,592 |
244 |
429 |
3,265 |
|
Chicken |
3,545 |
313 |
467 |
4,325 |
|
Butter |
4,695 |
465 |
393 |
5,553 |
|
Pork |
4,907 |
459 |
622 |
5,988 |
|
Sheep / Goat |
8,253 |
457 |
53 |
8,763 |
|
Beef |
14,414 |
550 |
451 |
15,415 |
As a result, it can be stated that white meat has an extremely environmentally friendly production as an animal protein source. White meat production is the sector that uses the world's water and feed resources most economically and efficiently, as well as the sector that pollutes the environment the least for animal food production with its smart systems and applications.
References
- Sezen Ocak, Sinan Öğün, Ebru Emsen, Turkey's Animal Production Water Footprint; Heading in the Wrong Direction, Procedia Technology, Volume 8, 2013, Pages 255-263, ISSN 2212-0173, https://doi.org/10.1016/j.protcy.2013.11.035.
- P.W. Gerbens-Leenes, M.M. Mekonnen, A.Y. Hoekstra, The water footprint of poultry, pork and beef: A comparative study in different countries and production systems, Water Resources and Industry, Volumes 1–2, 2013, Pages 25-36, ISSN 2212-3717,
- P.W. Gerbens-Leenes M.M. Mekonnen A.Y. Hoekstra. A comparative study on the water footprint of poultry, pork and beef in different countries and production systems. DECEMBER 2011 VALUE OF WATER RESEARCH REPORT SERIES NO. 55. UNESCO-IHE Institute for Water Education P.O. Box 3015 2601 DA Delft The Netherlands.
- Mekonnen, M.M., Hoekstra, A.Y. A Global Assessment of the Water Footprint of Farm Animal Products. Ecosystems 15, 401–415 (2012). https://doi.org/10.1007/s10021-011-9517-8
- WWF (Dünya Doğayı Koruma Vakfı)-Türkiye, Türkiye’nin Su Ayak İzi Raporu 2014 https://waterfootprint.org/en/resources/interactive-tools/product-gallery/
- http://awsassets.wwftr.panda.org/downloads/su_ayak_izi_raporweb.pdf